
Bitcoin remains under sustained selling pressure, trading around $71.5K as the market continues to digest one of the sharpest corrections since the 2022 bear cycle. With key moving averages still sloping downward and no major structural level reclaimed, the probable path remains to the downside until proven otherwise.
Bitcoin Price Analysis: The Daily Chart
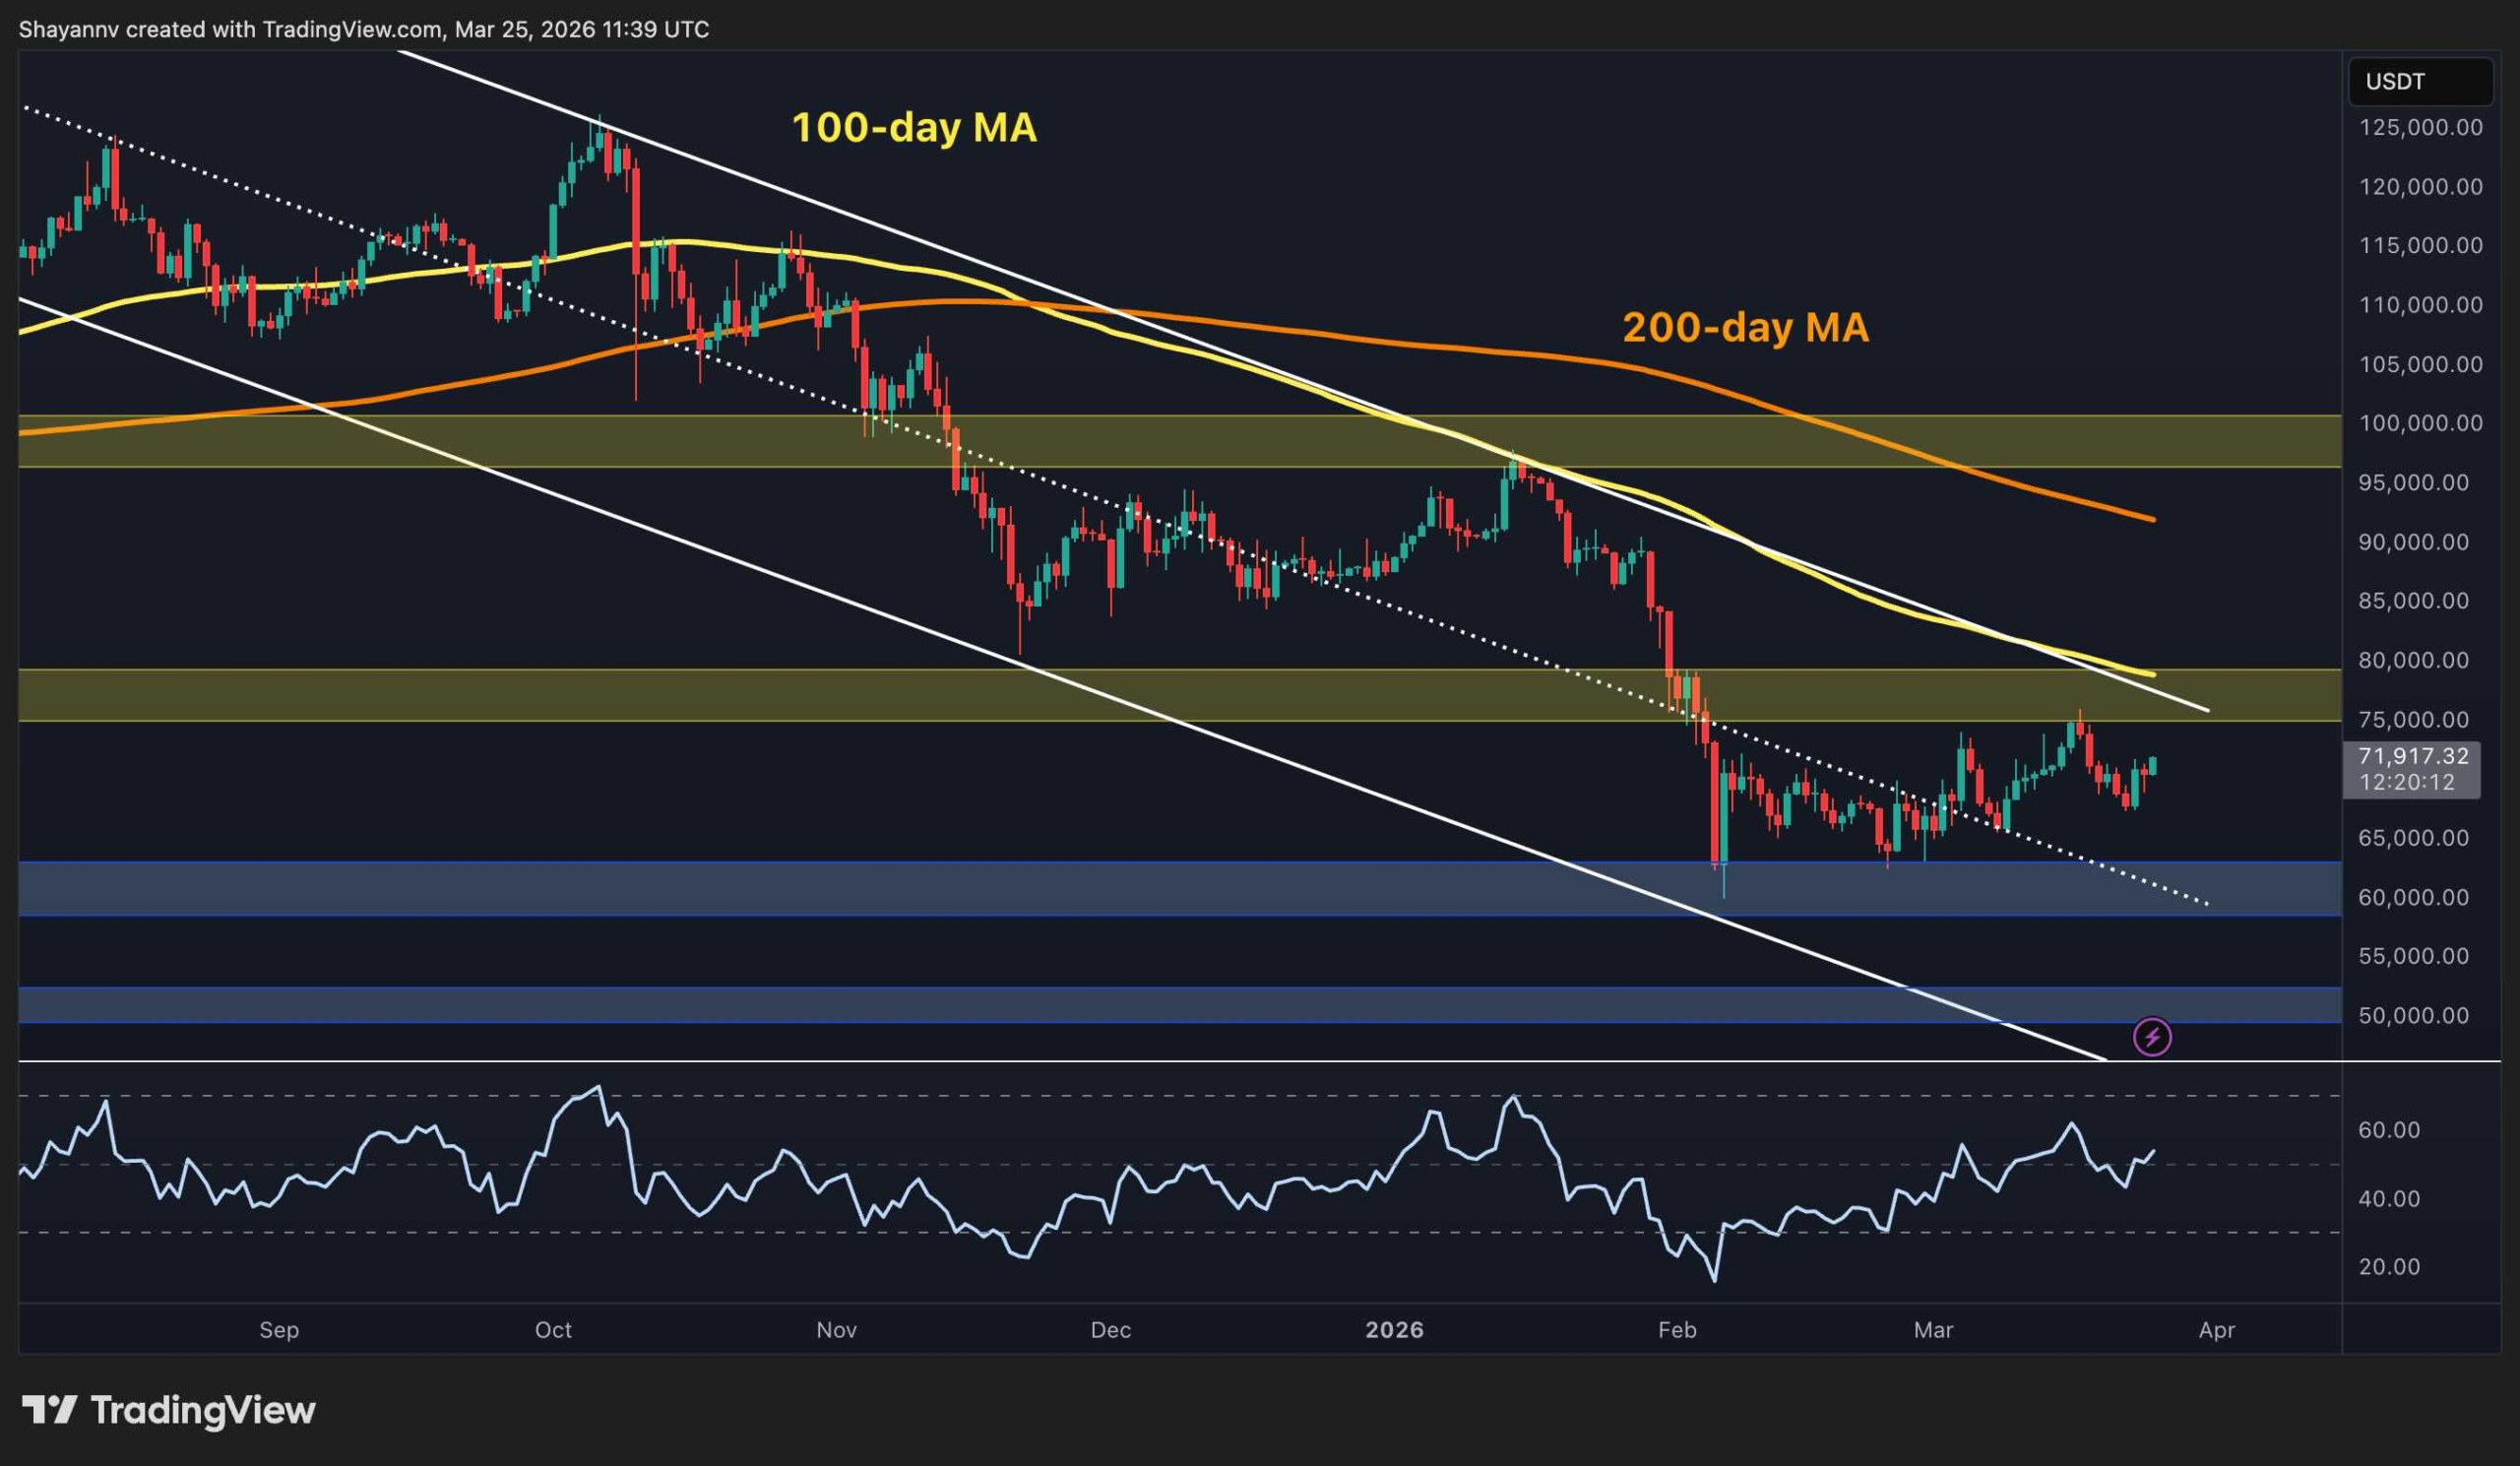
BTC is still trading inside a descending channel on the daily chart, with the 100-day moving average (~$79K) and the 200-day moving average (~$92K) acting as significant overhead barriers. The $75K–$80K zone, which was solid support through much of late 2025, has now flipped to resistance and rejected every recovery attempt in recent weeks.
The RSI has also recovered meaningfully from its February lows below 20 and is now trending around the mid-50Ks, which is an improvement, but still short of the bullish territory needed to signal trend reversal. Key support remains at $60K–$62K, with $50K as the next major level below if that zone fails.
BTC/USDT 4-Hour Chart
On the 4-hour chart, BTC continues to consolidate within a symmetrical triangle that has been forming since early February, with the price currently trading around $71.5K, near the middle of the pattern. The upper boundary near the $75K supply zone has rejected the asset on multiple occasions, reinforcing it as the immediate resistance to watch.
The RSI on this timeframe has also bounced from the low-30s and is trending upward above 60, suggesting short-term buying pressure is building. A decisive break above the triangle’s upper trendline and the $75K resistance band would be a meaningful short-term bullish signal, while a breakdown below $62K would likely send the price below the February support zone and continue the overall downtrend.

Sentiment Analysis
Funding rates across all exchanges have been predominantly negative since late January. It marks a stark shift from the consistently positive readings seen throughout Bitcoin’s 2025 bull run. This persistent negativity reflects an overcrowded short side in the futures market, which historically can act as fuel for a short squeeze if spot demand picks up.
That said, negative funding alone is not a bullish catalyst. The prolonged stretch of red bars since February suggests traders were actively betting against a recovery rather than simply hedging, until this week, when the rates have shifted slightly positive again. Until the price reclaims a key structural level on the daily chart, the funding data is better read as a reflection of bearish conviction than a contrarian buying signal.

Binance Free $600 (CryptoPotato Exclusive): Use this link to register a new account and receive $600 exclusive welcome offer on Binance (full details).
LIMITED OFFER for CryptoPotato readers at Bybit: Use this link to register and open a $500 FREE position on any coin!
Disclaimer: Information found on CryptoPotato is those of writers quoted. It does not represent the opinions of CryptoPotato on whether to buy, sell, or hold any investments. You are advised to conduct your own research before making any investment decisions. Use provided information at your own risk. See Disclaimer for more information.
Other Articles

Strategy manager wrong about BTC backing STRC

No Comment! Be the first one.