
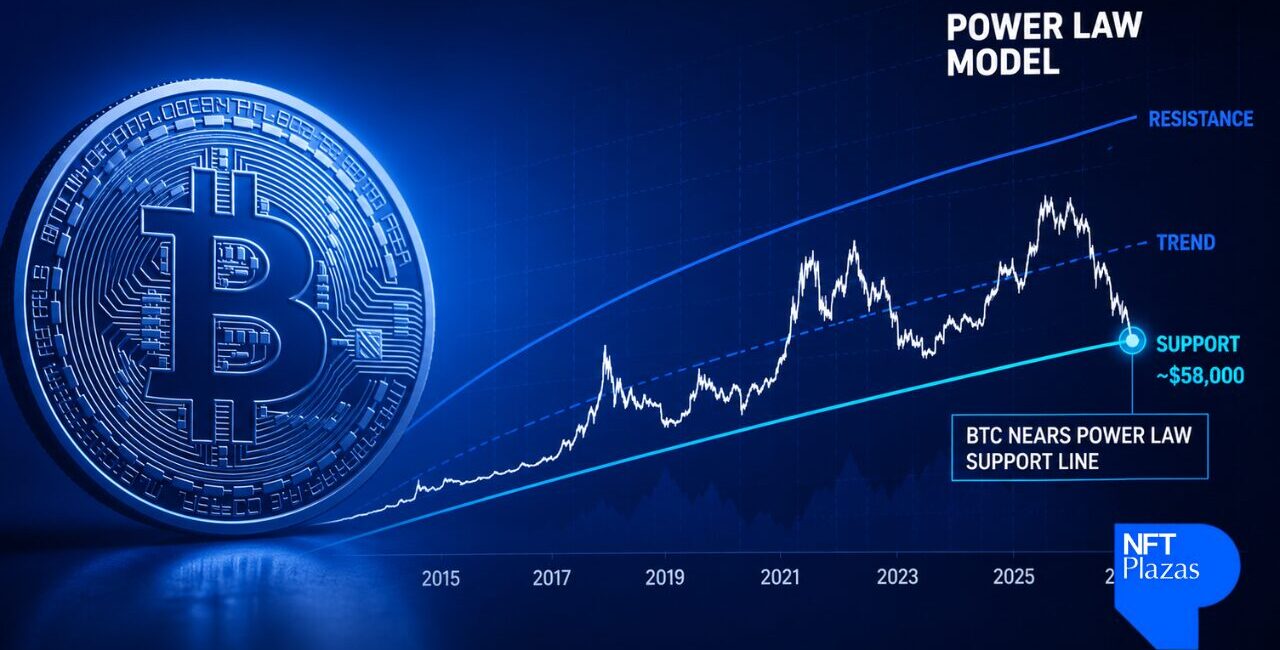
Bitcoin is approaching one of the most closely watched long-term technical levels in institutional crypto analysis, according to Fidelity Investments’ Director of Global Macro, Jurrien Timmer. After months of persistent selling pressure, the world’s largest cryptocurrency is trading near the lower boundary of Fidelity’s long-running Bitcoin Power Law model—a support zone that has coincided with every major market bottom since 2015.
While Timmer cautions that the market may not have reached its ultimate low, he argues that Bitcoin has entered an area historically associated with long-term accumulation rather than speculative excess. The key question, however, is not whether Bitcoin is cheap relative to its historical trend, but whether global liquidity conditions are ready to support the next sustained rally.
Fidelity’s Power Law Model Signals a Familiar Opportunity
Unlike traditional valuation models, the Bitcoin Power Law attempts to explain Bitcoin’s long-term price trajectory using logarithmic growth rather than fixed market cycles. The framework plots Bitcoin’s entire trading history inside three gradually rising curves: an upper resistance band, a central trendline representing fair value, and a lower support boundary where previous bear markets have consistently found their floor.
According to Timmer’s latest chart, that lower support currently sits around $58,000, with Bitcoin trading near $62,700, leaving the asset less than 10% above a level that has historically marked major turning points.
The model has demonstrated notable consistency over the past decade. During the 2015 bear market, Bitcoin bottomed only slightly below the projected support curve. Similar behavior occurred during the capitulation phases of 2018 and 2022, when prices stabilized close to the Power Law floor before beginning multi-year recoveries.
Although no technical model guarantees future performance, the historical alignment has made the Power Law one of the more widely followed long-term valuation frameworks among institutional investors.

Fidelity’s Power Law Model Signals a Familiar Opportunity
Accumulation Indicators Are Flashing Again
Beyond the support line itself, Timmer highlights two additional indicators that have reached levels previously associated with Bitcoin cycle lows.
The first measures Bitcoin’s deviation from its long-term Power Law trendline. That reading has fallen to approximately -56%, placing the asset firmly inside what Fidelity labels the “accumulation zone.” Similar readings occurred only during the market bottoms of 2018 and 2022.
A second indicator compares Bitcoin’s performance against gold over a rolling 52-week period. The Bitcoin-to-gold ratio has dropped to roughly -100%, suggesting Bitcoin has significantly underperformed the precious metal over the past year.
Historically, these extreme readings have emerged when investor sentiment toward Bitcoin reached maximum pessimism while long-term buyers quietly accumulated positions.
One important characteristic of the Power Law model is that support rises over time. That means Bitcoin does not necessarily need to fall to $58,000 for the support test to occur. If prices simply consolidate while the support curve gradually climbs, the market could still complete the historical pattern through sideways trading rather than another sharp decline.
Liquidity Remains the Missing Catalyst
Despite the encouraging technical setup, Timmer has deliberately stopped short of declaring that Bitcoin has bottomed.
His primary concern is macroeconomic liquidity.
According to Timmer, the speculative premium that propelled Bitcoin above $120,000 during last year’s rally has largely disappeared. At the same time, global money supply growth has slowed, reducing the amount of excess liquidity that typically fuels risk assets.
Without renewed monetary expansion or improving financial conditions, Bitcoin could remain trapped near its support zone for an extended period before any meaningful recovery begins.
This view aligns with previous Bitcoin bear markets. The bottoms in 2015, 2018, and 2022 were not followed by immediate V-shaped rebounds. Instead, Bitcoin spent several months trading sideways before improving macro conditions allowed a new bull market to emerge.

Bitcoin (BTC) Price Performance on July 14, 2026 (Source: CoinMarketCap)
Capital Rotation Has Shifted Away From Bitcoin
Another observation from Timmer’s analysis is that institutional capital has not disappeared entirely—it has simply moved elsewhere.
According to Fidelity, speculative investors first rotated from Bitcoin into gold as macro uncertainty increased. More recently, capital has continued flowing toward semiconductor and artificial intelligence stocks, sectors that currently offer stronger earnings momentum.
That rotation helps explain why Bitcoin has struggled despite continued institutional adoption through spot Bitcoin ETFs and growing corporate interest in digital assets.
While short-term momentum traders have largely exited the market, longer-term investors appear to be accumulating instead. On-chain analytics from firms including Coinglass have also shown continued buying activity among larger Bitcoin holders during recent weakness, even as overall market sentiment remained subdued.

Total Bitcoin Spot ETF Net Inflow (USD) (Source: Coinglass)
Why the Power Law Still Matters
The Power Law has attracted attention not simply because it identifies potential bottoms, but because it has historically highlighted both market extremes.
During previous bull markets, Bitcoin repeatedly approached the model’s upper boundary before major corrections followed. Likewise, the lower boundary has consistently marked periods when downside risk became increasingly limited relative to long-term upside potential.
This symmetry gives the framework more credibility than models that focus exclusively on bullish price projections.
Still, Timmer acknowledges that the Power Law should be viewed as a valuation framework rather than a precise timing tool. Different analysts produce slightly different versions of the model, placing current support anywhere between approximately $51,000 and $58,000 depending on methodology.
For long-term investors, however, those differences may be less significant than the broader conclusion: Bitcoin is trading much closer to historically attractive valuation levels than it was during last year’s euphoric highs.
What Investors Should Watch Next
Whether Bitcoin ultimately finds support around current levels will likely depend less on technical analysis than on broader macroeconomic conditions.
Investors should monitor several key indicators over the coming months, including global money supply growth, Federal Reserve policy expectations, institutional ETF flows, and changes in the Bitcoin-to-gold ratio.
A sustained recovery in liquidity would strengthen the historical case made by Fidelity’s Power Law model. Until then, Bitcoin may continue behaving as Timmer suggests—drifting near long-term support while patient investors quietly accumulate.
For now, the Power Law does not promise that Bitcoin has reached its absolute bottom. Rather, it indicates that the market has once again entered a region where previous cycles shifted from fear toward long-term opportunity, even if confirmation takes months rather than days.

Other Articles

Songs for pumping and dumping: crypto’s Spotify leak

No Comment! Be the first one.